Clustering Analysis
(a) Overview
Clustering is an unsupervised machine learning technique that groups similar data points together based on their features. Unlike supervised methods, clustering does not require labeled outcomes. There are two primary types of clustering, partitional clustering which divides data into k non-overlapping clusters based on a defined distance metric, and hierarchical Clustering which builds a tree by successively merging or splitting clusters. For this analysis, the euclidean distance for k-means and cosine similarity for hierarchical clustering were utilized. Clustering helps uncover natural groupings within Colorado population projections and demographics, allowing for deeper insight into regional service needs for behavioral health.
Sample of Data Used
(b) Data Preparation
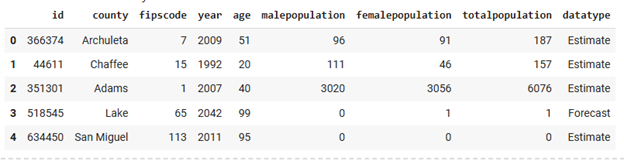
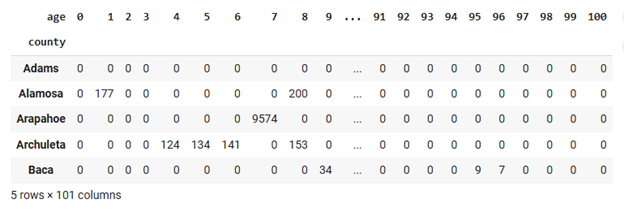
Clustering requires unlabeled, numeric input data. I extracted a subset of demographic and population projection features from my cleaned dataset and scaled it using StandardScaler to ensure uniform contribution across variables. Below is a sample of the data used:
Data Preparation for Clustering
(c) Clustering Code
Clustering Colorado Population Notebook
(d) Results
To identify patterns in projected population structures across Colorado counties, both k-means clustering and hierarchical clustering was applied to age-based population projections for the year 2050.
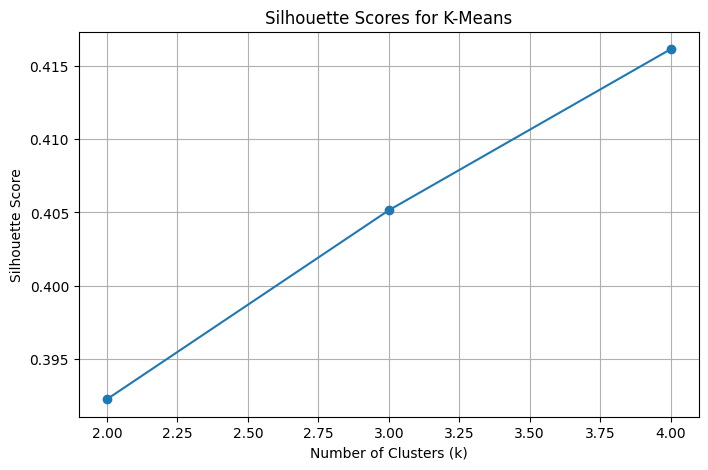
K-Means clustering was applied using three different values of k (2, 3, and 4) to explore how Colorado counties group based on age-distributed population projections for 2050. The silhouette scores for each value of k were: 0.392 for k = 2, 0.405 for k = 3, and 0.416 for k = 4, indicating that four clusters yielded the most well-separated and coherent groupings. Silhouette scores measure how similar each data point is to its own cluster compared to others. Thus higher scores reflect better-defined clusters. Based on this analysis, k = 4 was selected as the optimal number of clusters to describe distinct population patterns across counties.
Silhouette Scores for k-Means
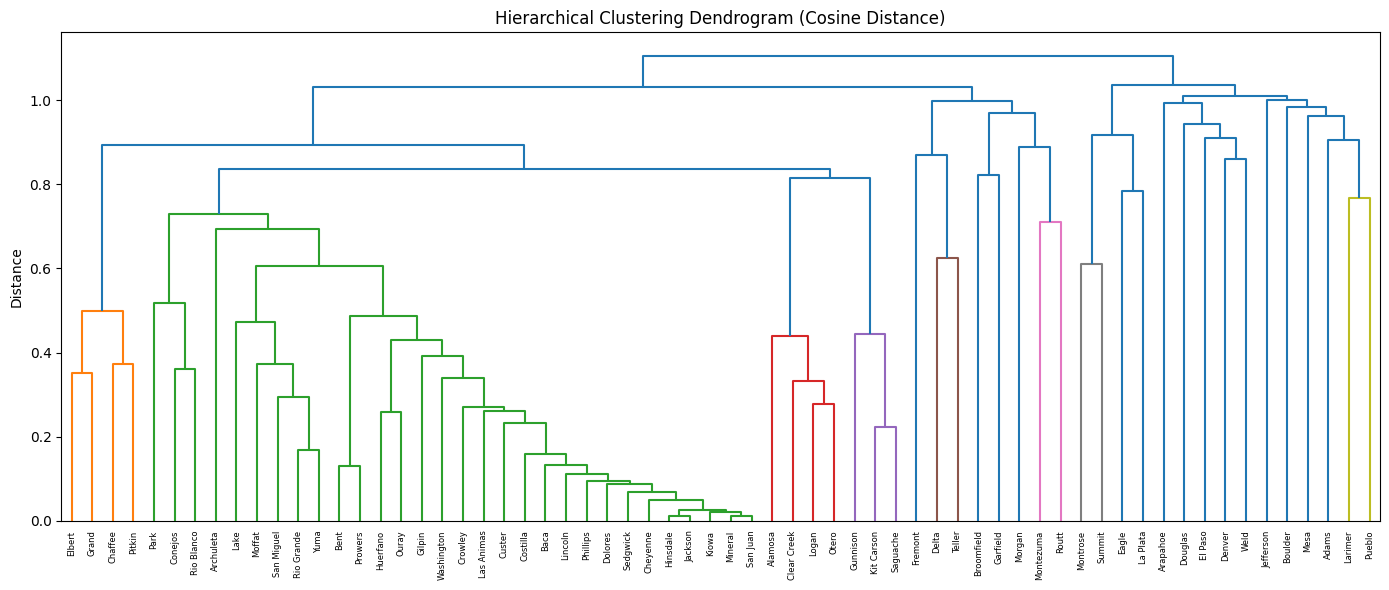
In addition to K-Means, hierarchical clustering using cosine distance and average linkage was performed to uncover how counties relate based on the shape of their age distribution curves. The resulting dendrogram reveals a tree-like structure showing how clusters form step-by-step, starting with the most similar counties. This method helps visualize the relative closeness of population age structures across the state. A comparison of cluster assignments from hierarchical clustering and K-Means (at k = 3) shows general agreement for many counties. For example, Alamosa, Archuleta, and Baca were consistently grouped together. However, some counties such as Adams and Arapahoe were assigned to different clusters depending on the method used. This divergence suggests that cosine similarity captures subtle differences in relative age proportions that may not be as pronounced when using Euclidean-based K-Means clustering.
Hierarchical Clustering Results
(e) Conclusions
Through clustering analysis of Colorado’s projected county-level population data for the year 2050, it was uncovered that distinct groupings of counties with similar age distributions. These clusters provide valuable insight into how future behavioral health service demand may vary across regions. For example, one group of counties may be characterized by a larger proportion of older adults, signaling an anticipated need for geriatric mental health services, while another cluster may reflect a younger demographic profile, indicating future demand for youth and adolescent behavioral health interventions.
The combination of K-Means clustering (with optimal k = 4) and hierarchical clustering (using cosine similarity) offered complementary perspectives on how these counties align in terms of population structure. These methods revealed that counties often group not just by total population, but by the shape of their age distribution a factor that can directly influence the type and volume of mental health services required in coming decades.
By identifying clusters of demographically similar counties, this work provides a foundation for regional planning, targeted outreach, and more accurate demand forecasting in behavioral health. These insights are essential for informing policy decisions and resource allocation strategies across the state.