PCA Analysis
(a) Overview
Overview: Principal Component Analysis (PCA) is a widely used dimensionality reduction technique that transforms a dataset with many correlated variables into a smaller set of uncorrelated variables called principal components. These components capture the most variance in the original data. PCA is eigenvalues and eigenvectors. Eigenvectors define the direction of the new feature space and determine the axes. Eigenvalues represent how much variance is in the data by each component. The first principal component (PC1) captures the direction of maximum variance in the dataset. The second principal component (PC2), orthogonal to the first, captures the next highest variance. Selecting the top few components reduce the dataset’s dimensionality and retain most of its informative structure.
Dimensionality reduction is the process of simplifying a dataset by reducing the number of features. This is important when working with high-dimensional data for several reasons.One reason is improved visualization, reducing data to a few principal components enables visual exploration and better pattern recognition. Reducing noise is another important reason because high-dimensional data often contains irrelevant or redundant features. PCA filters out these less informative dimensions. Using PCA maintains the structure integrity of the data while making it more manageable for analysis, visualization, and modeling. This is useful in the study of population-level census microdata.
Sample of Census DataFrame

Data Prep
Principal Component Analysis requires numerical, standardized, and unlabeled data. For this analysis, a subset of variables were selected from the ACS 5-Year Public Use Microdata Sample (PUMS) 2023 dataset via the Census API. The dataset was cleaned to retain only relevant columns such as age, income, education level, and employment status, and all categorical variables were encoded numerically. Below is a sample of the cleaned dataset used in PCA.
Transformed PCA DataFrame
Code
Results
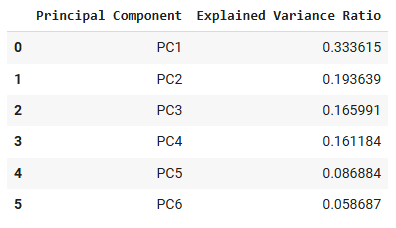
To better understand the structure of the census microdata, Principal Component Analysis was conducted on six numeric variables: SEX, AGEP, SCHL, ESR, HINS1, and PWGTP. Before applying PCA, visualization was used for correlation matrix, which revealed moderate correlations between variables like AGEP and ESR, as well as SCHL and AGEP. This indicated some redundancy in the features and justified the need for dimensionality reduction.
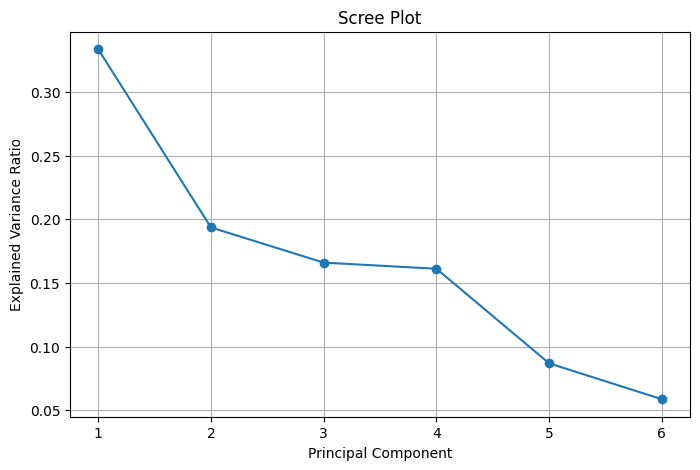
The scree plot of the explained variance ratio shows that the first two principal components together explain a large portion of the total variance, with diminishing returns for each additional component. This informed the decision to reduce the dataset to two principal components for visualization purposes.
Scree Plot of PCA Results
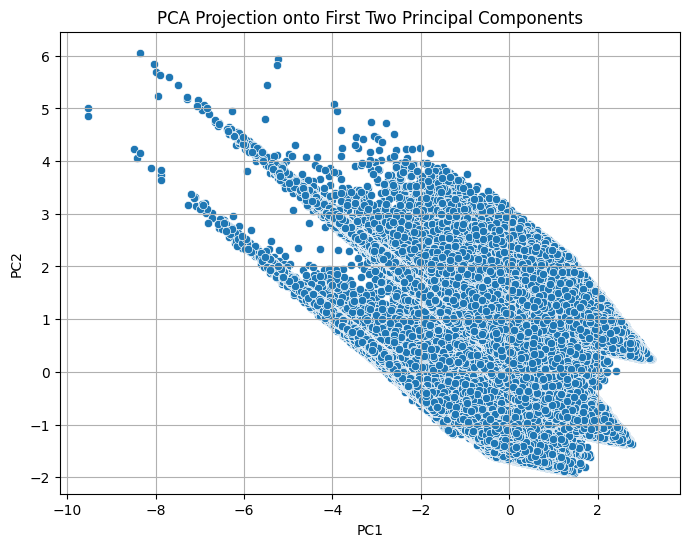
The final scatterplot projects the dataset onto the first two principal components, revealing underlying patterns and groupings not easily visible in the raw high-dimensional data. This transformation simplifies the analysis and prepares the data for downstream tasks like clustering or classification, while preserving the majority of its variability.
PCA Projection onto First Two Principal Components
Conclusions
Through Principal Component Analysis, the dimensionality of the census microdata was reduced while retaining variance in a few components. This transformation helped simplify the data and made it easier to identify relationships between demographic characteristics like age, education, employment status, and health insurance coverage. By reducing redundancy and noise in the data, PCA enhances the efficiency and accuracy of predictive models or methods applied later. It also enables clearer insights into the population structure, which can inform where and how to target future mental health resources based on key demographic drivers.