Naives Bayes
(a) Overview
Naive Bayes is a type of classifier that uses probability to make predictions. It is based on the Bayes’ Theorem, which helps estimate the chance of something happening based on known information. The “naive” part refers to the assumption that all input features are independent from each other. Naive Bayes works very well with large datasets. It is commonly used in spam filters, document sorting, medical diagnoses, real-time predictions, and credit scoring. The model calculates the probability of each possible outcome and picks the one with the highest score.
Bernoulli Naive Bayes is a version of this algorithm made for data with only two possible values, like yes/no or 0/1. It is particularly useful for problems where data is present or not. For example, if a word appears in a document or not. It uses a Bernoulli distribution and tends to penalize missing expected features more than other versions like Multinomial Naive Bayes. This method works best with binary or categorical data. Even though the assumption of independence is not always accurate, Naive Bayes is still widely used because it is easy to understand and often effective.
Data Prep
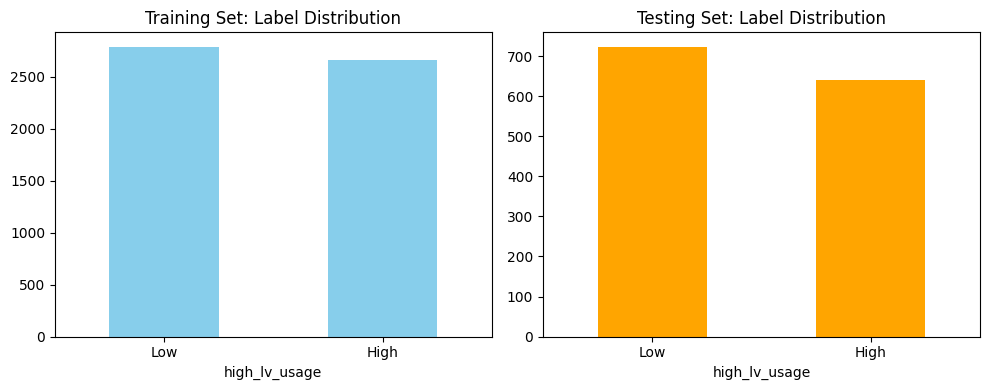
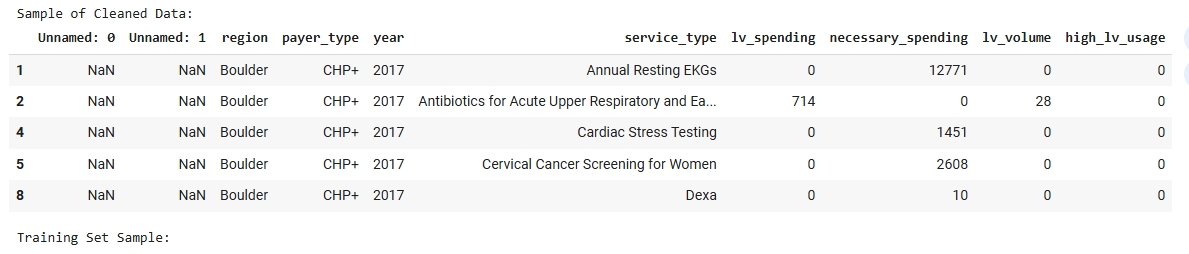
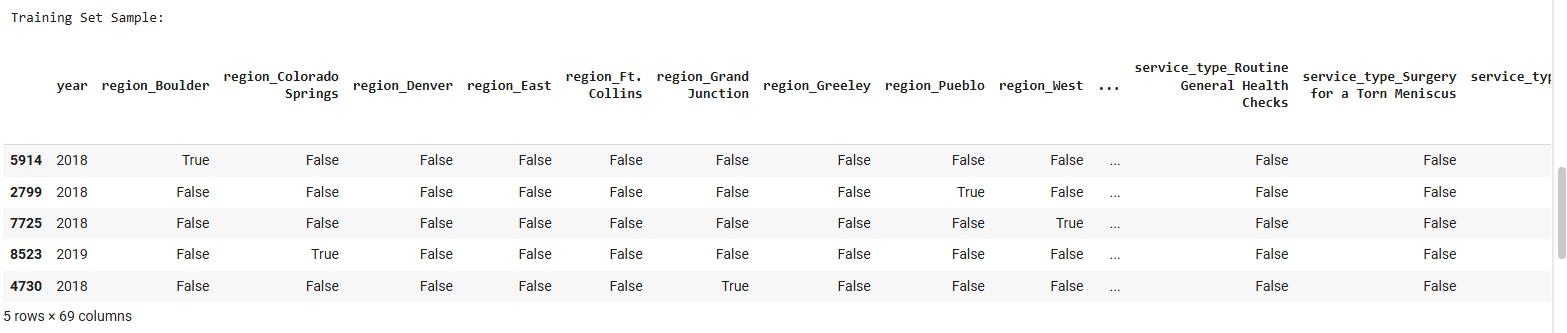
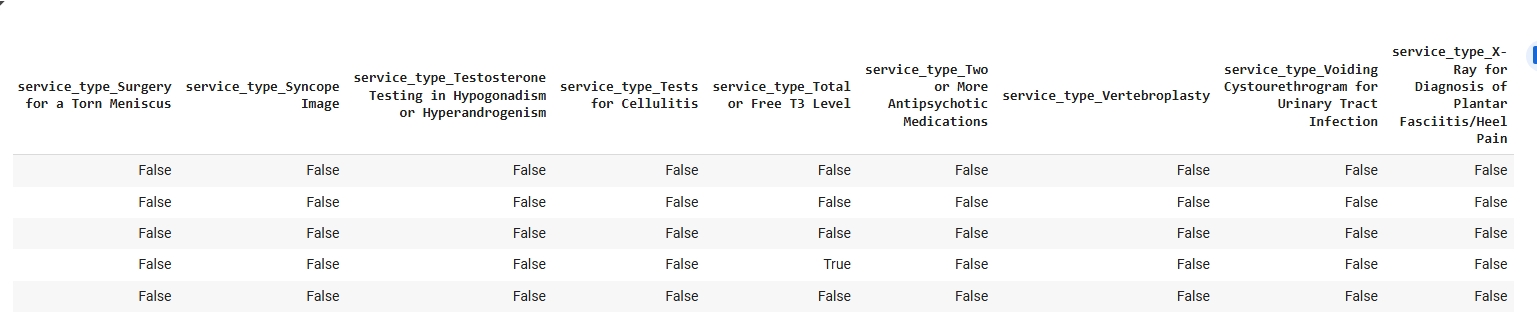
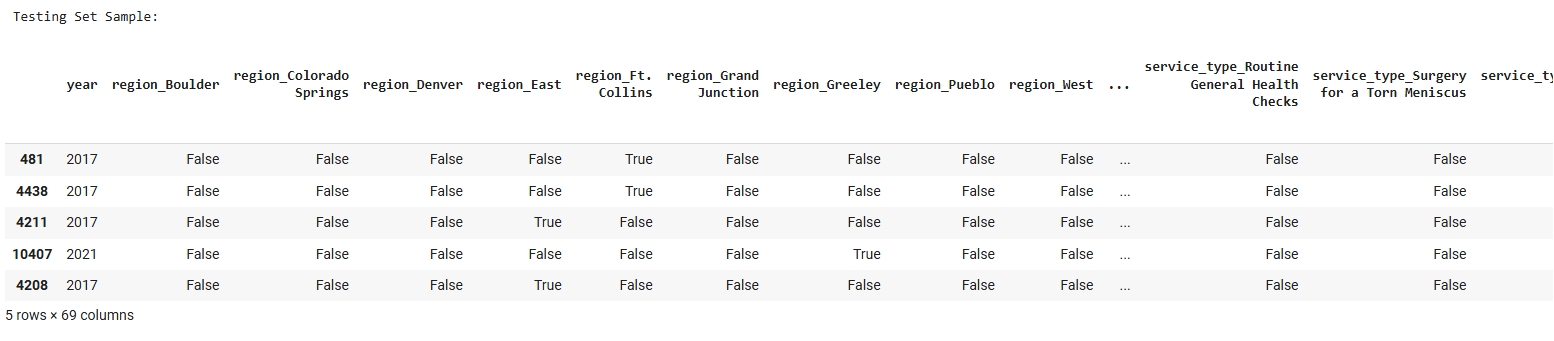
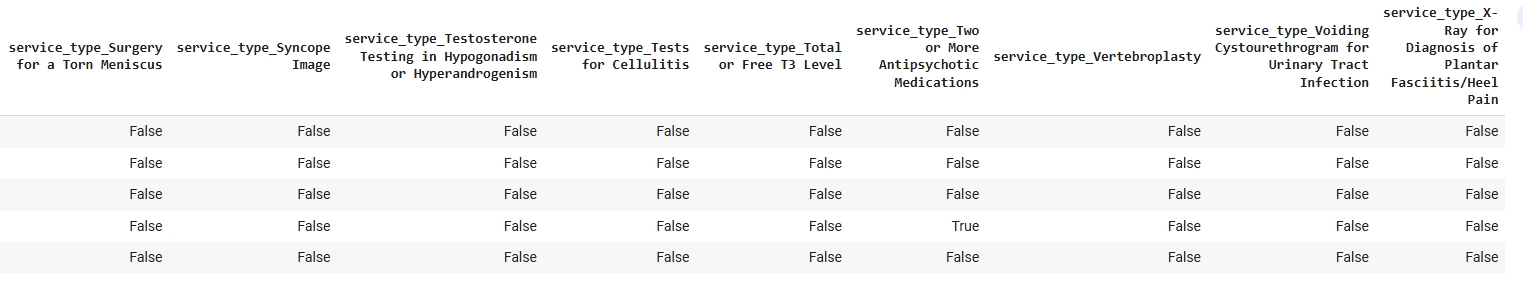
The dataset used for the Naive Bayes classification model was derived from a cleaned and structured version of the FY23 Low Value Care data. Since Naive Bayes is a supervised learning algorithm, it requires labeled data with a target variable that the model will learn to predict. In this case, the binary target label “Need Level” (e.g., High or Low) was used to train and evaluate the model. To prepare the data, it was first encoded to ensure that all features were numeric, as required by Scikit-learn’s Multinomial Naive Bayes implementation. The dataset was then split into a Training Set and a Testing Set using an 80/20 ratio. The split was conducted randomly to preserve representativeness while ensuring that the two subsets remained disjoint to ensure no overlap between training and testing data. This separation is important for accurately assessing the model’s ability to generalize to unseen data. The images below include a sample of the cleaned dataset, training and testing subsets, and a visualization of class distribution used to validate the balance of the target variable before model training.
Dataset Used
The FY23 Public Low Value Care dataset dataset was used for this Naive Bayes classification. This dataset contains labeled examples used to train and test the model. Only labeled data can be used in supervised learning methods like Naive Bayes.
Training Set Samples:
Testing Set Samples:
Code
View Naive Bayes Python Notebook
Results
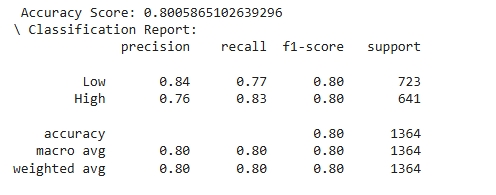
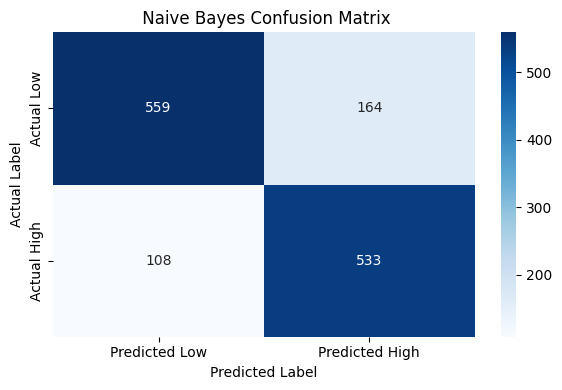
The decision tree model shows reliable performance across both target classes. For the “Low” usage class, the model achieved a precision of 0.84, indicating that 84% of the predictions labeled as “Low” were correct. In contrast, the “High” usage class had a slightly lower precision of 0.76. However, recall for the “High” class was notably strong at 0.83, suggesting the model is effective at identifying true instances of high low-value care usage—a critical insight for pinpointing at-risk regions. Both classes achieved an F1-score of 0.80, reflecting a strong balance between precision and recall. The support values, 723 for “Low” and 641 for “High,” confirm that the test set was relatively balanced. Overall, the model does not favor one class significantly over the other, with a slight lean toward catching more “High” usage cases. This makes the decision tree model a solid baseline tool for forecasting behavioral health service gaps using available proxy indicators.
 —
—
Conclusions
This analysis demonstrates that current patterns of low-value care utilization, combined with payer type, service type, and regional indicators, can serve as a useful proxy for identifying regions that may be at risk for future behavioral health service demand. By training a Naive Bayes classifier on this data, the model was able to accurately distinguish between regions with high versus low volumes of unnecessary services. The model achieved an overall accuracy of 80%, with balanced precision and recall across both categories. This performance suggests that existing claims-based utilization patterns are meaningful signals of regional healthcare behavior and potential system strain.
The ability to classify regions based on current inefficiencies provides a foundation for proactive planning. In particular, regions classified as high-usage may indicate underlying issues such as poor access to preventive or coordinated care factors often linked to behavioral health gaps. As Colorado’s population continues to grow and shift, this model could be extended by integrating projected demographic changes to estimate where behavioral health demand is most likely to rise. Ultimately, this work supports a data-driven approach to identifying future service needs and informing policy, resource allocation, and system design for mental health care in the state.